6) Solar is also growing fast, though it’s still pretty tiny
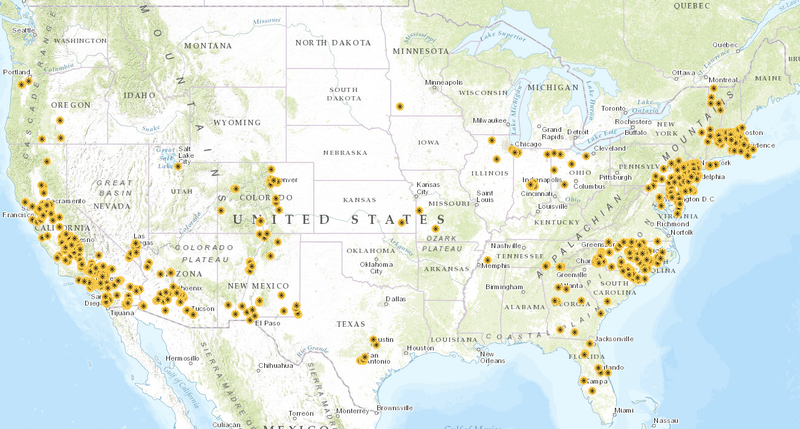
The map below shows large solar power plants around the country (it doesn’t, however, show every last rooftop solar system):
 (Energy Information Administration)
For all the hype it gets, solar power still plays only a small role in the US energy system — providing around 0.6 percent of electricity in the first half of 2015.
But solar is also growing very fast, and it has a lot of devoted fans. Hillary Clinton is proposing to boost solar’s share of electricity to around 5 percent by 2020.
What’s behind the solar surge? It helps that solar panel prices have plummeted, thanks to a boom in Chinese manufacturing. But US installers like SolarCity have also been experimenting with creative financing schemes, making it easier for people to put up rooftop panels without paying high upfront costs. Then there are subsidies, like a 30 percent federal tax credit and “net metering” laws that allow homeowners to sell excess solar electricity back to the grid. These incentives can vary from state to state, which explains why you see a lot of solar in New Jersey but less in, say, Oklahoma.
Meanwhile, some electric utilities have fretted that as more and more people install photovoltaic systems on their roofs, that could cut into electricity sales from traditional power plants. David Crane, CEO of NRG Energy, has called these trends “a mortal threat to the existing utility system,” and some power companies have been pushing to scale back net metering laws. See here for the backstory.
